Frequency Difference Method (FD) 
To eliminate the disadvantages with the position difference method, the
Frequency Difference Method was developed. This method is one of the basic
measuring principle for the DELTATEST measuring system and will be explained
in the following.
Characteristic for the principles is that the coil is simultaneously
supplied with current of at least two frequencies and that the sensor
can consist of only ONE coil.
This means that in ONE point, just under the coil, eddy currents of
different frequency content are induced in the surface.
As will be explained later, a surface defect influences the different
frequencies unequal, which is a basic condition for the realisation of the
method.
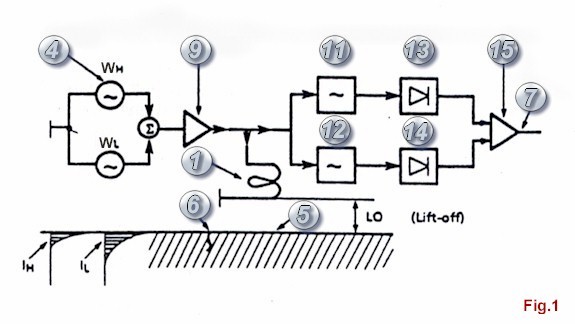
In our figure 1 is shown how generator (4) generates signals of different
frequencies which are mixed together in a special amplifier (9) which then
is supplying the coil (1) with "constant" current containing all frequencies.
The voltage over the coil is direct proportional to the impedance of the coil
for each frequency.
In the same way as for the position difference method this impedance is
influenced by eddy current disturbances from surface defects as cracks and
oscillation marks.
In the figure, the current (IH, IL) penetration depth from two frequencies
has been marked with dashes areas. Somewhat simplified one can say that these
different currentpenetration depths means that a crack (6) will disturb this
eddy currents of different frequencies (WH, WL)unequally.
Contrary to the crack, eddy currents of different frequencies are not disturbed
unequally by varying distance (Lift Off) between the coil and the surface of the
object.
There are two different reasons for this different behavior between a crack
and a variation in LO-distance:
- 1. A varying LO-distance is not a surface defect
that obstruct eddy currents.
- 2. The same coil is used for the both frequencies,
which means that the two frequencies are both influenced
by exactly the same LO-distance and sensor design.
The voltage drop over the coil is first separated into the original frequencies
WH, WL via filters (11, 12) and then rectified in synchronous rectifiers (13, 14).
The direct voltages (DCH, DCL) are now proportional to the electrical impedance
of the coil for frequency respectively and constitute in-put signals to a
difference amplifier (15).
At varying LO-distance the direct voltages (DCH, DCL) are following each
other and no output signals is obtained from the difference amplifier (15).
A crack however, generates direct voltages not following each other and
consequently, produces a difference signal (7), wich then is indicating the
precence of a crack.
It can now be understood that a crack can be detected and indicated as a difference
between the various
impedance influences at different frequencies that the crack is reason to.
This way to measure is called FREQUENCY DIFFERENCE METHOD, developed by
TÖRNBLOMS KVALITETSKONTROLL, and is UNIQUE for the DELTATEST-system.
Vector Transformation (VTF)
An established and verified principles to explain eddy current technology is
to us normalised impedance diagrams, and such a diagram for a surface sensor
coil will therefore be used to explain the important VTF-design principle for
the DELTATEST-system.
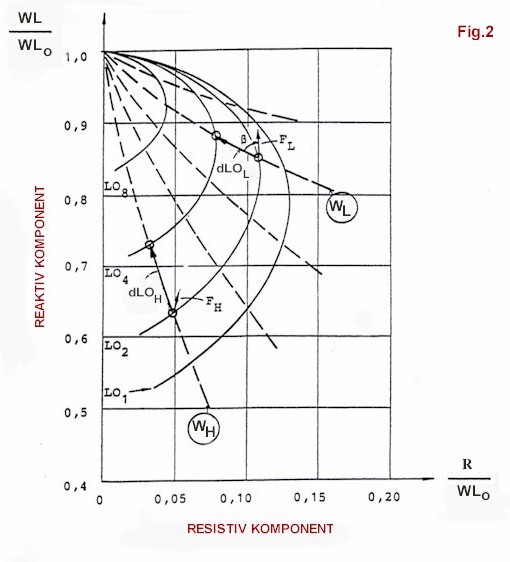
In our figure 2, the impedance of the coil is shown at diffent conditions.
The vectors show the impedance changes of the sensor when influenced by different
parameters.
The length and direction of the vectors correspond to the amplitude and phase
angle of the output signal of the sensor.
The LO-curves represent different distances (LO) between the sensor and the test
object.
The dashed lines represent frequencies (W).
To simplify the explanation only two frequencies are used (WL, WH), where WL
is the low frequency and WH is the high one.
When the distance from the sensor to the test surface is changed, the impedance
of the sensor is changed for the two frequencies (WL, WH), with the vectors
dLOL and dLOH respectively.
In frequency difference measuring, the difference in impedance value between the
frequencies is measured.
If it therefore is arranged in such a way that dLOL = dLOH, e.g. by different
amplification in the electronics, no difference will occur between the frequencies
(varying distances between the sensor and the test surface).
The practical and very important consequence of this is:
Variations in Lift-Off do not disturb the measuring!
When the sensor is influenced by a crack, this also results in impedance changes,
which is illustrated by vectors (FL) and (FH) in the figure. As can be seen the
change in impedance is not the same for different frequencies;
(FL) is not equal to (FH).
The relative sensitivity for cracks has approximate its maximum when the resistive
component of the impedance is on its maximum or where the LO-curves are bulging
to the right as most in the figure.
The explanation is that the eddy current losses are proportional to the resistive
component of the impedance. This in turn is the reason why (FL) > (FH).
If now the impedance value for the low frequence ( WL) is chosen to be multiplied
by a correction factor (cf) in order to get (LOL) = (LOH), the crack vector (FL)
is simultaneously amplified correspondingly.
As originally (FL) > (FH), this relation will be even greater after the amplification,
so that cf x (FL) >> (FH).
The difference in impedance value between the frequencies,
expressed as: cf x (FL) - (FH) is not equal to 0, indicates the precence of a crack.
(1) cf x dLOL - dLOH, = 0
(2) cf x (FL) - (FH) is not equal to 0
The two non-complicated equations above, represent the theoretical
foundation-stones for the FREQUENCE DIFFERENCY METHOD, developed by
TÖRNBLOMS KVALITETSKONTROLL,which is the basis for the DELTATEST
frequency difference measuring system.
Frequency Selection (FS)
The description of the Vector Transformation design principle in the
foregoing chapter also explains why the selection of the frequencies is
of great importance for obtaining a maximised difference in crack impedance
value for the cracks. To achieve this optimisation the following criteria
can be set up:
- WL little distance dependence
large crack dependence
- WH large distance dependence
little crack dependence
From the impedance diagram can be seen that this criteria met where the
(WL) -curves crosses the LO-curves in the resistance maxima.
For (WH), the following is valid: the higher the frequency, the larger
the distance dependence and the smaller the resistive component, i.e. the
most favourable measuring conditions are found here.
The DELTATEST measuring system has for this reason a high frequency ratio.
Summary: The FREQUENCY DIFFERENCE METHOD, developed by TÖRNBLOMS
KVALITETSKONTROLL, including Vector Transformation and Frequency Selection,
is the base for an effective suppression of Lift-Off Variations, resulting
in a stable measuring signal even if vibrations in the sensor, in the sensor
support mechanism or in the test object itself should occur.
|